Frogs in Ayrshire were spawning last week, a few days before World Frog Day 2021 but unchanged over the past 40 years. Continuing the theme of what external events trigger amphibians to breed, I wondered what had happened further after the extensive research of R. Maxwell Savage on the Common Frog, Rana temporaria in Britain from the 1920s to the 1950s. Savage was something of a mystery man as far as I was concerned. Not only to me I discovered because I was delighted to find that Trevor Beebee had found himself in a similar position. Trevor appealed for information and the result was contact with the Savage family and a short biography in a 2010 issue of Herpetological Journal. I will return to Savage’s life and achievements in a later post but I should say now that I have him down, using my grandsons’ terms, as a super-hero in British herpetology.
I remember reading Savage’s book, The Ecology and Life History of the Common Frog (Rana temporaria temporaria) rather quickly around 1963-64, three years after it was published; quickly because it had to be returned to the library. However, I do remember being aware that one of its main conclusions, that earlier spawning is associated with higher rainfall in the month or so before the actual event, I knew of before then. But how did I know and how did the person who told me know when I could remember being told the story before the publication of Savage’s book in 1961?
Some conversations and their locations stick in the mind while other events disappear from the memory banks. In summer 1959, several of us were in the Junior Biology Lab of the former and now completely demolished Henry Mellish Grammar School and with nothing much to do after taking ‘O’ levels were surveying the biodiversity (in modern terminology) of the school pond. We were talking about tadpoles and frogs when the senior biology master James John Key, who died in 1976 at the young age of 59, told us the story he had picked up about rainfall and spawning. Only when I was doing online searches on Savage did I remember how Jim Key had found out: Ronald Maxwell Savage was on the BBC Home Service radio programme The Naturalist on 8 March 1959. In the programme, edited and introduced by Maxwell Knight, ‘R. Maxwell Savage shows how the spring emergence and spawning of the common frog are stimulated by changes in the weather’ (Radio Times 5 March 1959).
Jim Key listened to that programme and to others on science, not only to keep himself informed of developments but as a source of ammunition for his arguments in the staff room with Stanley Revill, the senior history master, antiquary and archaeologist, who would ask provocative questions in order to stimulate conversation on weightier matters than who had last used the ink eradicator. For example, both listened to P.B. Medawar’s Reith Lectures in 1959, The Future of Man. By this time I was in the Lower VIth and Jim would appear, looking for arguments against (preferably) or for Stan’s latest pronouncement. ‘Natural selection has ended’ was one that kept us going right to the staff room door as Jim re-entered the fray.
After that digression, I want to consider what Savage had done that led him to the conclusion on the importance of rainfall. In Britain spawning date varies with geographical location and from year to year. Savage tried to determine the cause of these variations. It was only a part of his research on the Common Frog but it is an interesting one—and an important one given the effect of climate and weather on natural events. His paper was published in 1935 but he expanded on that exercise in his 1961 book.
Savage’s study of the spawning date of Common Frogs was an exercise in phenology—the study of the times of recurrence of natural phenomena and in particular the influence of climate on plants and animals. Britain has long been obsessed by such events as hearing the first cuckoo in spring or the first flowering of a plant. An enormous ‘citizen science’ project ran between 1891 and 1948 organised by the Royal Meteorological Society with up to 600 recorders submitting returns in some years. Each year a Phenological Report appeared. In the earlier years, the date of frogs spawning was reported but not included in the annual report. Savage searched the individual returns so that he had as complete a set of data as possible.
 |
| Savage produced this map from his analysis of phenological reports |
Savage then extracted seven meteorological readings from the Monthly Weather Reports compiled by the Meteorological Office. This was a massive task and he received special permission to borrow each volume of reports to work on at home during the evenings and weekends. In these days before computers, Savage entered the data by clipping punched cards (2,734 in all) and then sorted them for each variable by passing a needle through the relevant hole and allowing those clipped to fall out of the stack. In that way, the standard method in statistical operations of the time, he built up tables for analysis and ‘joint functional regression diagrams’.
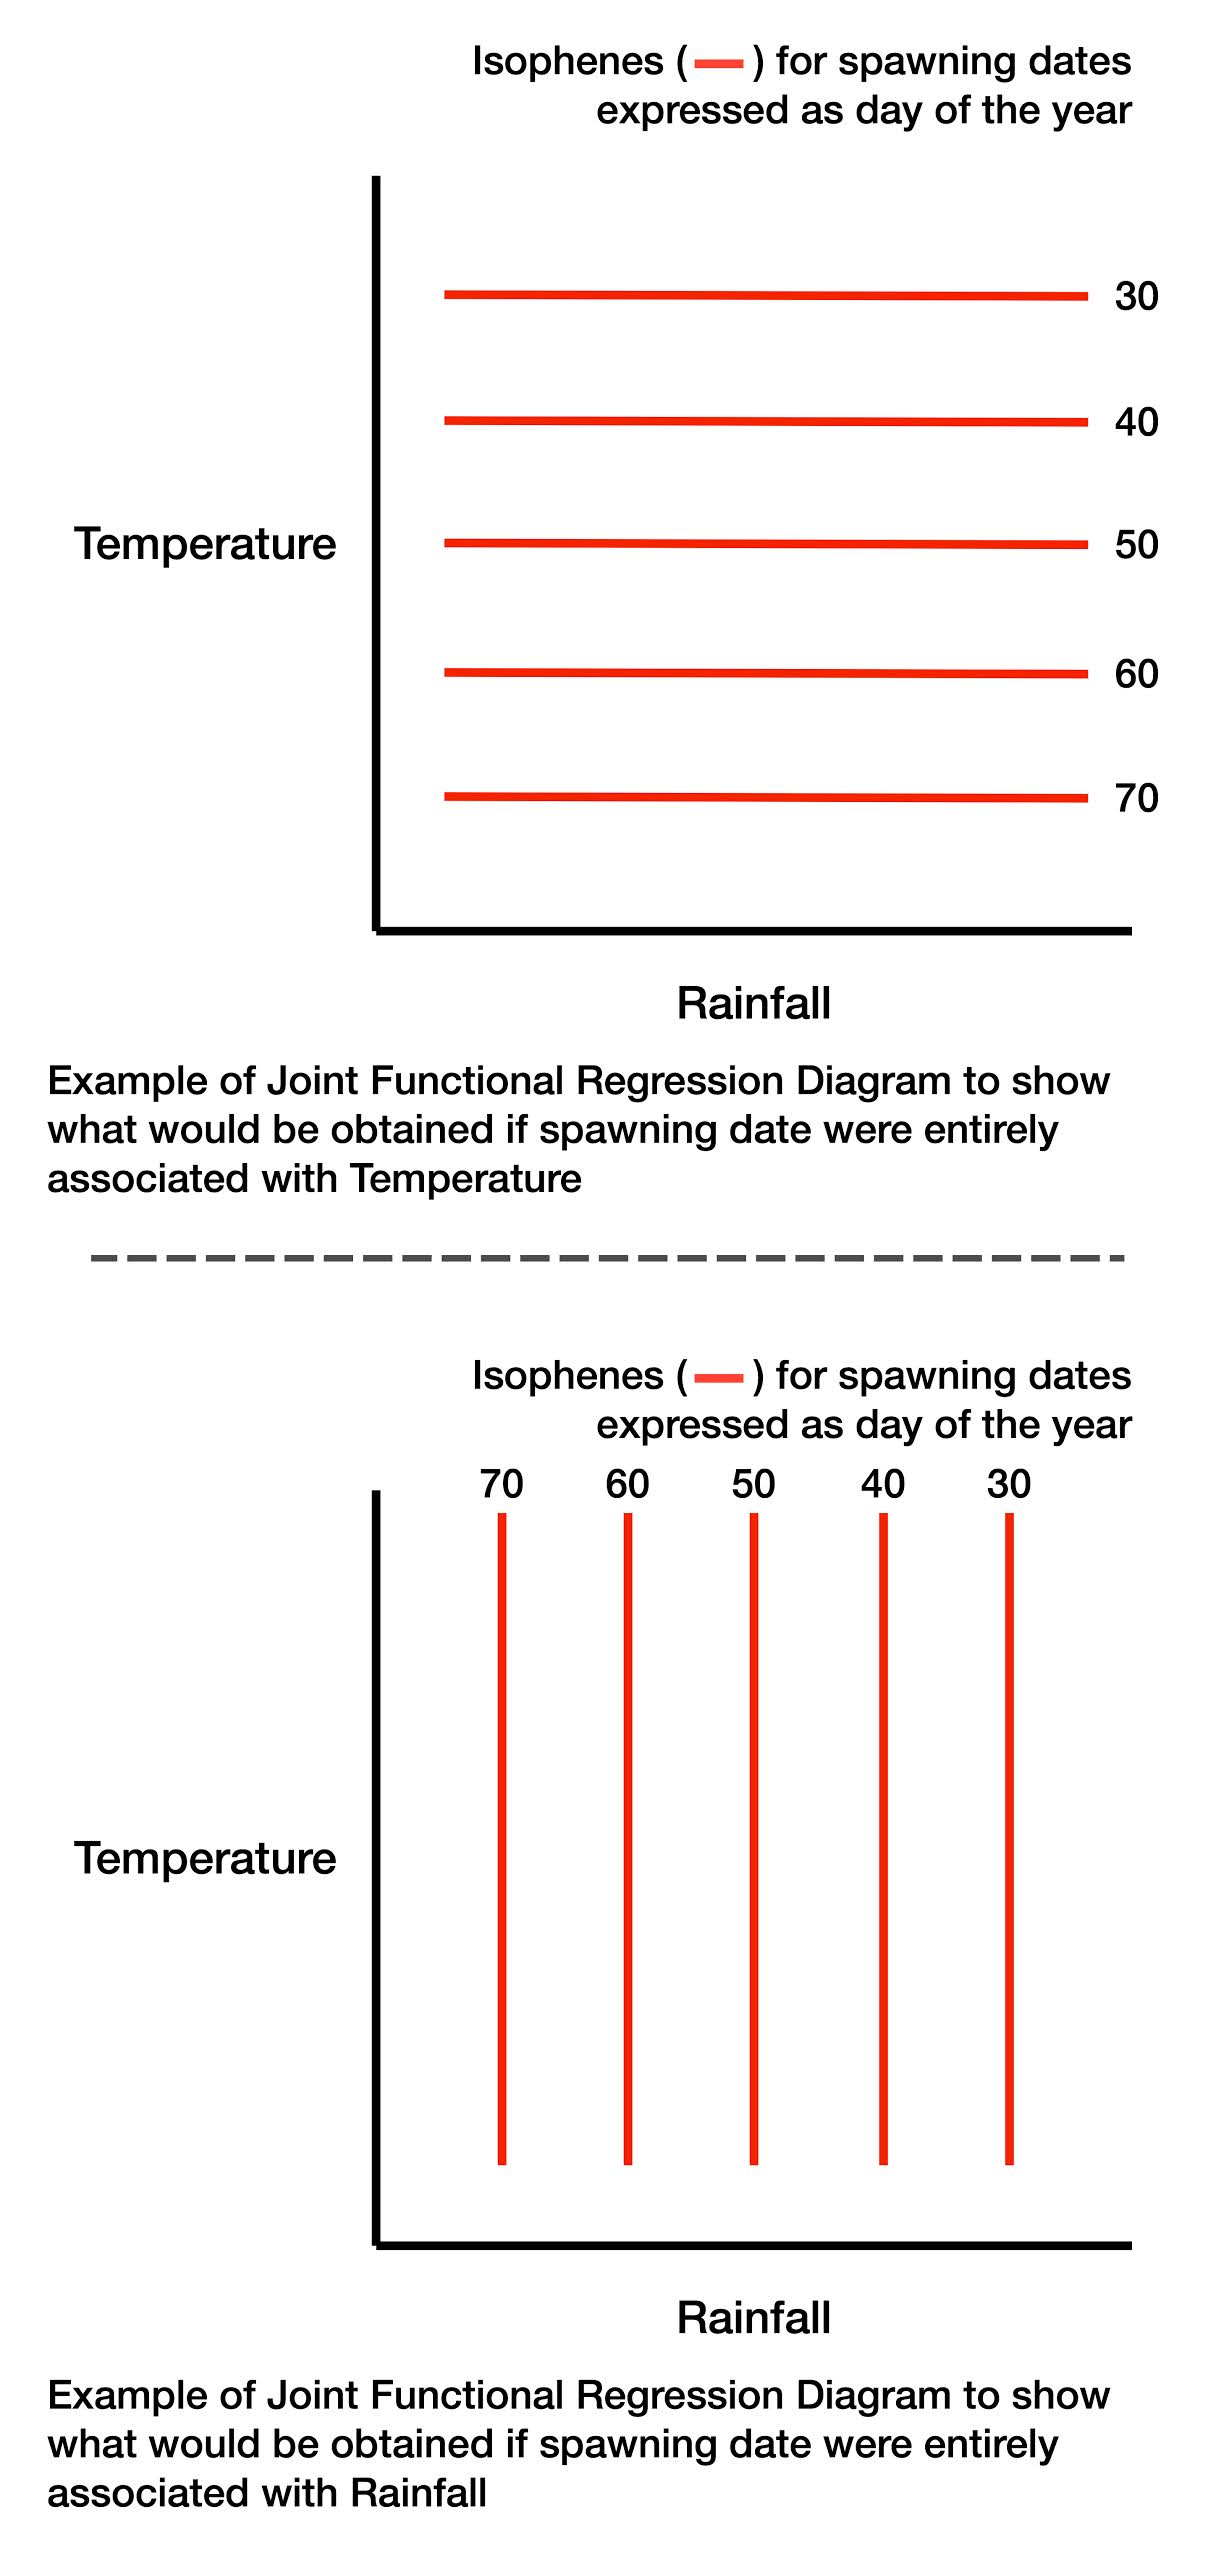
The diagrams he produced need a little explanation. He was able to plot on a graph, with average monthly rainfall and average monthly temperature as the axes, points at which spawning occurred on certain dates (expressed as day of the year, eg 1 January = 1 etc). He then joined equal dates of spawning with a line—an isophene—analogous to an isobar on a weather map. Each diagram then had a family of isophenes ranging from early spawning (day 20, i.e. 20 January) to very late spawning (day 90, 31 March).
To digress for what he would have obtained had the date of spawning been simply associated with temperature or rainfall, I show theoretical diagrams below. In each case the isophenes would be parallel to one axis or the other. But Savage did not obtain isophenes parallel to an axis. The isophenes were curved showing a complicated relationship between temperature, rainfall and spawning date.
 |
| Savage's Diagrams showing isophenes of day of spawning. The shades areas are where there we no data |
Savage’s significant contribution was to look at the patterns of rainfall, temperature and spawning not just in the month of spawning but in each of the two months before spawning. However, he then hit a problem because the usual month of spawning was not the same throughout Britain, as his map showed, and was sometimes variable from year to year in any one region. Therefore for each record he designated the month of spawning as M0, the previous month as M1 and the month before that as M2. The reader of his book can be confused by this notation because it would have seemed more logical to denote the month before breeding as M-1 etc.
He had to use months as the unit because the meteorological records were presented as averages for a particular month. That made his conclusions for the month of spawning, M0, potentially less valuable as he explained:
It is obvious that the weather near the end of M0 cannot affect the actions of frogs spawning at the beginning, and, for that reason, the use of a mean value for this month must introduce errors. It is, however, a property of the weather that it runs in spells, so that the Meteorological Office can head its monthly reports with a condensed summary in a short phrase, such as “Warm in the west, colder and windy in the rest of the country”. The mean values used in this work are therefore not so bad a measure as would appear at first sight.
Savage went into considerable detail in attempting to interpret the three diagrams. I will limit what follows. In general, in the month of spawning (M0), early dates for spawning are associated with higher rainfall; both relatively and high and relatively low temperatures with low rainfall are associated with later spawning. A similar conclusion can be reached about the month before spawning (M1). By contrast, two months before that of spawning (M2), temperature is far more important, higher temperature being associated with earlier spawning. An effect of rainfall is still present particularly at lower temperatures.
It is the marked association of rainfall in the preceding month or so with the date of spawning that Savage talked about on the BBC in 1959.
Savage demonstrated clearly an association between rainfall and spawning date, an association stronger at that time than the effect of temperature. It doesn’t need stating that demonstration of an association is not a demonstration of causation or that rainfall is not a proxy for some other event associated with high rainfall. However, the shift in spawning date seen after the extremely cold winter of 1947 (with ponds frozen until after day 70) argues in favour of an effect of, at least, severe changes in environmental conditions. In 1940-46 in south-west England the average day of spawning was 36 (5 February); in 1947 it was 77 (18 March).
Ecologists have often seemed reluctant to embrace experiment (a criticism that does not extend to Savage) and as far as I have been able to determine, there has been no experimental test of the effect of rainfall and temperature on the date of spawning. If, say, frogs from parts of the east of Scotland or of east Anglia (regions with late average spawning dates) were moved to Cornwall would they conform to the early spawning date observed there?
Savage thought he knew why higher rainfall is associated with early spawning and how the effect is brought about. This is an important I shall return to in a future article since it is a theme that runs through all Savage’s observations and research.
Ronald Maxwell Savage spent an enormous amount of his time—months of work he stated—in pre-computer days on extracting the data, preparing the data for analysis and doing the final statistical calculations. He thanked ‘Dr Frazer’ [John Francis Deryk Frazer, 1916-2008] for copying out the spawning dates from the Phenological Reports. Therefore, I find it odd that Deryk Frazer made so little of the approach or of Savage’s findings, confining the inadequate description to a short paragraph, in his Reptiles and Amphibians in Britain which was published in 1983 in the New Naturalist series,. Perhaps I should not have been too surprised because in the same volume he also misinterpreted Savage’s later work.
As well as producing his diagrams, Savage, a skilled exponent of statistical analysis for reasons I will explain in a later article, used multiple regression analysis on the meteorological, location and spawning date data in order to determine the influence of individual factors. In addition to rainfall and temperature he included altitude, latitude, longitude and hours of bright sunshine. From this analysis he obtained a multiple linear correlation coefficient of 0.74, remarkably high, he suggested, for such data; I agree. That would account for just over 50% of the variation in spawning data observed and, as Savage observed, could well be an under-estimate for reasons he explained.
I thought I would try, using Savage’s multiple regression equation that he showed in his book, and average local data to see if it produced a spawning date in the right ball park. However, I soon realised that one term (temperature in M2) was missing entirely and the coefficients for latitude and longitude seemed 10x out. Using the equation as it is shown produced nonsensical answers. Unfortunately, I have found no reference to its use by others nor to its obvious errors which must have occurred during conversion of units, copying or type-setting. If it were usable it could have provided a valuable tool to test the effect of increasing environmental temperatures on spawning date (see below) and how well it corresponded to current data on climate and spawning dates. It is unfortunate that the absence of ‘hard’ editing is often evident in Savage’s papers as well as in his book. There are some obvious errors as well as the reader—well this reader—being left puzzled by what seems to be an error, omission or lack of explanation. One example is that the beta coefficients shown in the regression equation on page 143 (with one missing) are not the same as shown in Table 7 on page 145.
Savage also showed the beta coefficients obtained in his regression analysis (i.e. the slope, negative or positive, for each component). He used their relative size to estimate the main factors. Retarding influences (i.e. later spawning dates) were associated with higher temperature in M0; increase in latitude; increased sunshine in M1. Accelerating influences were: increase in longitude; raised temperature in M2; increased rainfall in M1. These conclusion can, of course, also be deduced from his diagrams.
Therefore, In any one location from year to year, the effects of geography removed and the list of influences can be shortened. Retarding are: increased sunshine in M1; high temperature in M0. Accelerating are: high temperature in M2; increased rainfall in M1. However, this could not be the whole story since, as Savage observed, although some ponds were near together the frogs spawned at different times. Again, I will return to how Savage explained the differences in a later article.
Savage appreciated the importance of an effect on winter temperature (i.e. in M2) on spawning date and its compatibility with what was known about frog physiology. Gametogenesis is temperature dependent and Trevor Beebee found that between 1979 and 1994, although spawning date did not change significantly over that period at a single site, there was a strongly negative correlation with overall winter maximum temperatures*.
It would seem that the tradition of making rather little of Savage’s extensive work and statistical analysis, as exemplified by Frazer’s book and pointed out by Trevor Beebee, lives on. For example, in a recent paper on the possible effects of climate change on breeding in the Common Frog, Savage is mentioned but only in respect of noting that spawning dates may be different in ponds in the same area. Completely ignored in this new phenological analysis across a number of sites from 1994 onwards was the importance of the timing of rainfall in the months before spawning as found by Savage and the acceleration of spawning by higher temperatures in M2 but a retardation of spawning with high temperatures in M0. There was incidentally, no statistically significant trend for spawning dates to be earlier, although there was a tendency in that direction. The plot of spawning day versus year would have been dismissed by a late colleague as just ‘a swarm of bees’. Savage may have been wrong—or right—in his conclusions but his findings have to be explained in the light of further evidence, not ignored, as well as being taken into account in designing statistical procedures to analyse changes with time.
Finally, and with more on Ronald Maxwell Savage to come, the original data sources still exist. Somebody could re-extract the information, which would be time consuming but the months spent on statistical analysis—which could go much further than even Savage could crank out by hand—would be reduced to minutes. Given the importance of determining the effect of anthropogenic warming, these historical phenological records could be of much greater significance than Savage could ever have anticipated.
Beebee TJC. 1995. Amphibian breeding and climate. Nature 374, 219–220.
Savage RM. 1935. The influence of external factors on the spawning date and migration of the Common Frog, Rana temporaria temporaria Linn. Proceedings of the Zoological Society of London 105, 49-98.
Savage RM. 1961. The Ecology and Life History of the Common Frog. London: Pitman.
No comments:
Post a Comment